
Occupancy, capacity and growth
How to Increase Study Library Occupancy Without Overcrowding
Diagnose where serviceable capacity is going unused, choose the smallest appropriate intervention and protect the member experience while measuring comparable results.

Improvement chain
Measure → validate capacity → locate under-occupancy → segment → diagnose constraint → intervene → test → protect experience → repeat.
Quick answer
Diagnose the empty capacity before choosing the intervention
Do not begin with a discount or more advertising. First determine where genuinely serviceable capacity is unused and why. Under-occupancy can come from demand, conversion, usage, renewal, shift, plan, seat, availability, pricing, seasonality, operations or measurement.
Increase occupancy by matching real member demand to genuinely serviceable capacity—not by forcing more memberships into capacity the library cannot reliably serve.
No universal target
There is no universal ideal occupancy percentage, oversubscription ratio or guaranteed uplift. Use a defined metric, your own capacity state and comparable periods.
Measure correctly before optimizing
Conceptually, occupancy is Occupied Eligible Capacity ÷ Eligible Capacity × 100. The exact methodology belongs to the canonical occupancy measurement guide. Keep numerator, denominator, filters, date basis, capacity state and missingness visible.
Physical seats
Furniture or installed places. This is not automatically usable or sellable capacity.
Serviceable capacity
Physically usable, operationally available, eligible for the period and supportable under operating rules.
Occupied eligible capacity
The defined occupancy numerator. Allocation is not automatically physical presence.
Unavailable capacity ≠ empty sellable capacity. Maintenance, closure, zone restrictions and shift eligibility must be reflected rather than treated as a marketing gap.
Locate and segment under-occupancy
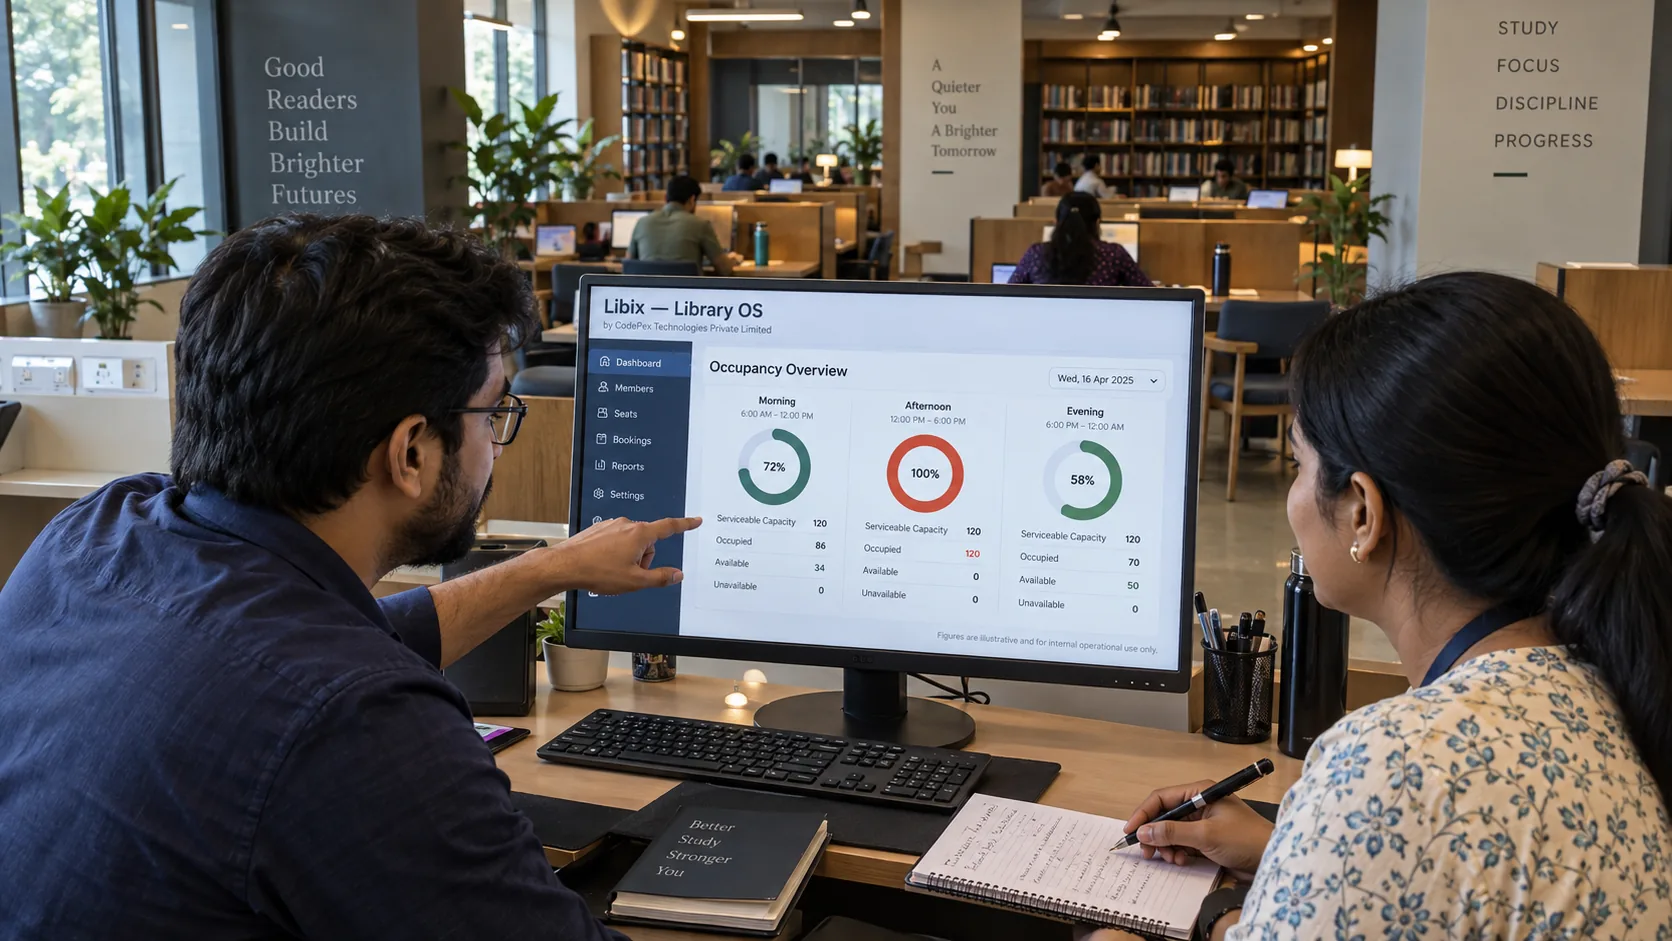
Segment by branch, floor or area, zone, seat where appropriate, shift, day and daypart. A single average can hide a branch that is full in the morning and evening while afternoons remain weak.
| Period | Illustrative occupancy | Question |
|---|---|---|
| Morning | 90% | Is this period constrained? |
| Afternoon | 35% | Is relevant demand available? |
| Evening | 95% | Would generic marketing worsen pressure? |
Illustrative figures only; they are not benchmarks.
Temporary under-occupancy
Holidays, examinations, maintenance, weather, local disruption or short academic cycles may create a weak comparable period.
Structural under-occupancy
A repeated pattern across comparable opportunities that merits a deeper constraint investigation.
Use an occupancy constraint tree
Question 1
Is eligible capacity genuinely available?
A “no” points to a different intervention family.
Question 2
Is there relevant enquiry demand?
A “no” points to a different intervention family.
Question 3
Are enquiries converting?
A “no” points to a different intervention family.
Question 4
Are admitted members using capacity?
A “no” points to a different intervention family.
Question 5
Are members renewing?
A “no” points to a different intervention family.
Question 6
Does demand match shifts and zones?
A “no” points to a different intervention family.
Match the lever to the diagnosed constraint
1. Relevant enquiry demand
If genuinely relevant enquiries are insufficient, investigate positioning, discoverability, referrals and local demand for the capacity that is actually available.
2. Enquiry conversion
If enquiries arrive but do not convert, investigate follow-up, plan clarity, requested-shift availability, admission friction and expectation mismatch.
3. Admission-to-usage
An admission is not physical presence. Check onboarding, entitlements, allocation, start timing, attendance and usage patterns.
4. Renewal and retention
Recurring expiry and non-renewal create recurring vacancies. Review member experience, plan fit, renewal process and reported reasons.
5. Shift and plan fit
Demand may exist at a different time or access window than the unused capacity. Reconfigure only after understanding the trade-off.
6. Seat and zone fit
Noise, lighting, airflow, desk condition, temperature or zone rules can make a branch attractive but a particular area underused.
Demand generation is not demand conversion. Acquisition is not retention. Admissions are not physical occupancy. Each requires its own evidence and specialist workflow.
Shift, plan, seat and availability fit
Demand may exist at different times or in different zones than the unused capacity. Review duration, access window, fixed/flexible seating, shift rules, plan restrictions, lighting, noise, airflow, desk condition and availability accuracy before redesigning plans or cutting price.
Peak full, off-peak empty
Protect peak service quality, identify genuinely usable off-peak capacity, understand who can use it, communicate it accurately and test voluntary demand movement. Do not run generic campaigns that create more peak demand.
Availability integrity
Staff may lose demand when they believe appropriate capacity is full, or disappoint prospects by promising capacity that is not available. Availability must reflect state, shift eligibility, allocations and closures.
Treat pricing, marketing and referrals as hypotheses
Low occupancy does not prove price is too high. Investigate perceived value, plan duration, communication, alternatives, actual availability, demand timing and realized revenue. A discount changes realized price and may fill peak capacity without improving contribution.
Marketing
Use it when relevant demand is genuinely insufficient. Market capacity that is actually available; do not create false scarcity.
Referrals
Can create relevant awareness when member experience is credible. Model the economics and do not pressure members to provide positive reviews.
Discounts
Test incremental contribution, peak-capacity effect, renewal effect and whether admissions are genuinely incremental.
Protect member experience and avoid overcrowding
Increasing occupancy must preserve study comfort, noise control, usable desk space, access reliability, facilities, safety and service quality. Never create “capacity” through incompatible double allocation, unavailable-seat sales, unsuitable spaces or arbitrary overbooking.
Occupancy improvement ≠ overselling. Business occupancy must not be confused with statutory building occupancy; any legal or safety claim requires authoritative verification.
Test interventions with comparable measurement
Record branch, zone, shift, baseline dates, diagnosis, hypothesis, intervention, capacity definition, guardrails, post-period, result and decision. Keep the same metric definition and account for closures, seasonality and concurrent changes. Use percentage points for rate differences and keep relative change separate.
Illustrative owner tool
Occupancy and intervention explorer
Use your own or hypothetical inputs. This tool does not rate the result, recommend an intervention or prove causation.
Occupancy snapshot
Rate
62.0%
Available
38
Uplift
14.0 pp
Intervention economics
Modelled incremental contribution
₹10,500
This is a user-entered scenario, not a profit guarantee. Not every new admission is incremental.
Build a diagnostic dashboard
A useful view should show numerator, denominator, rate, filters, period and capacity basis. Include branch, zone, shift, time, availability, enquiries, conversion, admissions, attendance, renewals and realized economics where definitions are compatible.
Common mistakes
Where Libix fits
Use connected operational evidence, where verified
Libix — Library OS, by CodePex Technologies Private Limited, can be evaluated as a connected operating foundation for seats, zones, shifts, allocations, attendance, memberships, enquiries, admissions, renewals and reporting. Current availability semantics, historical capacity, dashboards, analytics, branch comparison and any AI or real-time claims must be verified against approved documentation and the live implementation.
The product question is not whether software automatically increases occupancy. It is whether verified records help the owner see where eligible capacity is unused, investigate the cause and measure an intervention without inventing certainty.
Explore Business KPIsA practical action plan
1
Define
Choose the occupancy question and denominator.
2
Locate
Segment branch, zone, shift and time.
3
Diagnose
Test demand, conversion, usage, retention and fit hypotheses.
4
Test
Run a bounded intervention with guardrails and comparable measurement.
Occupancy improvement checklist
Frequently asked questions
What does increasing occupancy mean?
It means improving productive use of eligible, serviceable capacity after defining the denominator and investigating the cause of under-occupancy.
Why must occupancy be measured correctly first?
Because physical seats, unavailable seats, eligible shift capacity, allocations and actual presence are not interchangeable. A wrong denominator creates a false problem.
Is low occupancy always a marketing problem?
No. It can reflect conversion, renewals, shift or plan mismatch, poor availability, temporary closures, service friction, pricing or measurement error.
Should owners discount to increase occupancy?
Not automatically. Discounting changes realized revenue and may consume constrained peak capacity without improving contribution or retention.
Is maximum occupancy always desirable?
No. Overcrowding can damage comfort, safety, access reliability and member experience. Serviceable capacity and guardrails matter.
How should interventions be tested?
Use a defined baseline and comparable post-period with the same metric, capacity basis, filters and relevant context. Keep, modify or stop remains an owner decision.
Can Libix predict occupancy automatically?
Only describe current seat, shift, attendance, membership, enquiry, reporting or analytics capabilities after repository and product verification.